
One view for many signals
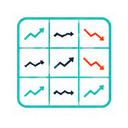
Choose the number of rows and columns, then give every card its own dataset, title, axis interpretation, unit, comparison rule and improving direction. Line, bar and area charts use the same compact visual language.
Attalos app
Build a clear grid of compact charts from your own spreadsheet data, or explore ready-to-use commodity trends in the public Market Monitor. TrendGrid is free, browser based, and designed for comparison at a glance.
Import Excel, CSV or JSON data card by card, choose the grid and chart type, configure comparisons, and export high-resolution PNG or PDF output.
Compare industrial metals, precious metals, energy and agricultural commodities with monthly, quarterly and yearly views, exports and widgets.
Get detailed answers about importing data, chart settings, calculations, exports, workspaces, privacy and troubleshooting.
Choose the number of rows and columns, then give every card its own dataset, title, axis interpretation, unit, comparison rule and improving direction. Line, bar and area charts use the same compact visual language.
TrendGrid recognizes dates, quarters, elapsed time, numeric axes and categories. Rename, reorder, duplicate or configure cards, undo changes, save a portable workspace and return to the same analysis later.
Your imported spreadsheet contents stay in your browser in the current version. TrendGrid does not require an account for chart building, local workspaces or export.
TrendGrid accepts Excel, CSV and JSON data. Each chart card can import and map its own label and value columns.
No. Imports, workspace persistence and chart exports are processed locally in the browser in the current version.
Market Monitor is a free public dashboard for metals, energy and agricultural commodities with monthly, quarterly and yearly comparisons.
TrendGrid supports high-resolution PNG and PDF output. Market Monitor also provides report-style chart-and-data PDFs, CSV, Excel and read-only widgets.