
Blog
PLA Strength: Infill, Layer Height, Speed and Walls
See how infill, walls, layer height and speed changed PLA tensile and bending loads in ASTM-based tests, with practical slicer settings.
I have published and co-authored several academic papers over the years.
Some of them are written in the traditional academic language: long sentences, precise terminology, abbreviations, statistical tables, and words that are perfectly valid but not always friendly.
That language has its place. A research paper needs to be careful, compact, and technically defensible.
But it is not always the easiest way to explain an idea.
So this post is an attempt to take one of those studies and bring it back to the workshop.
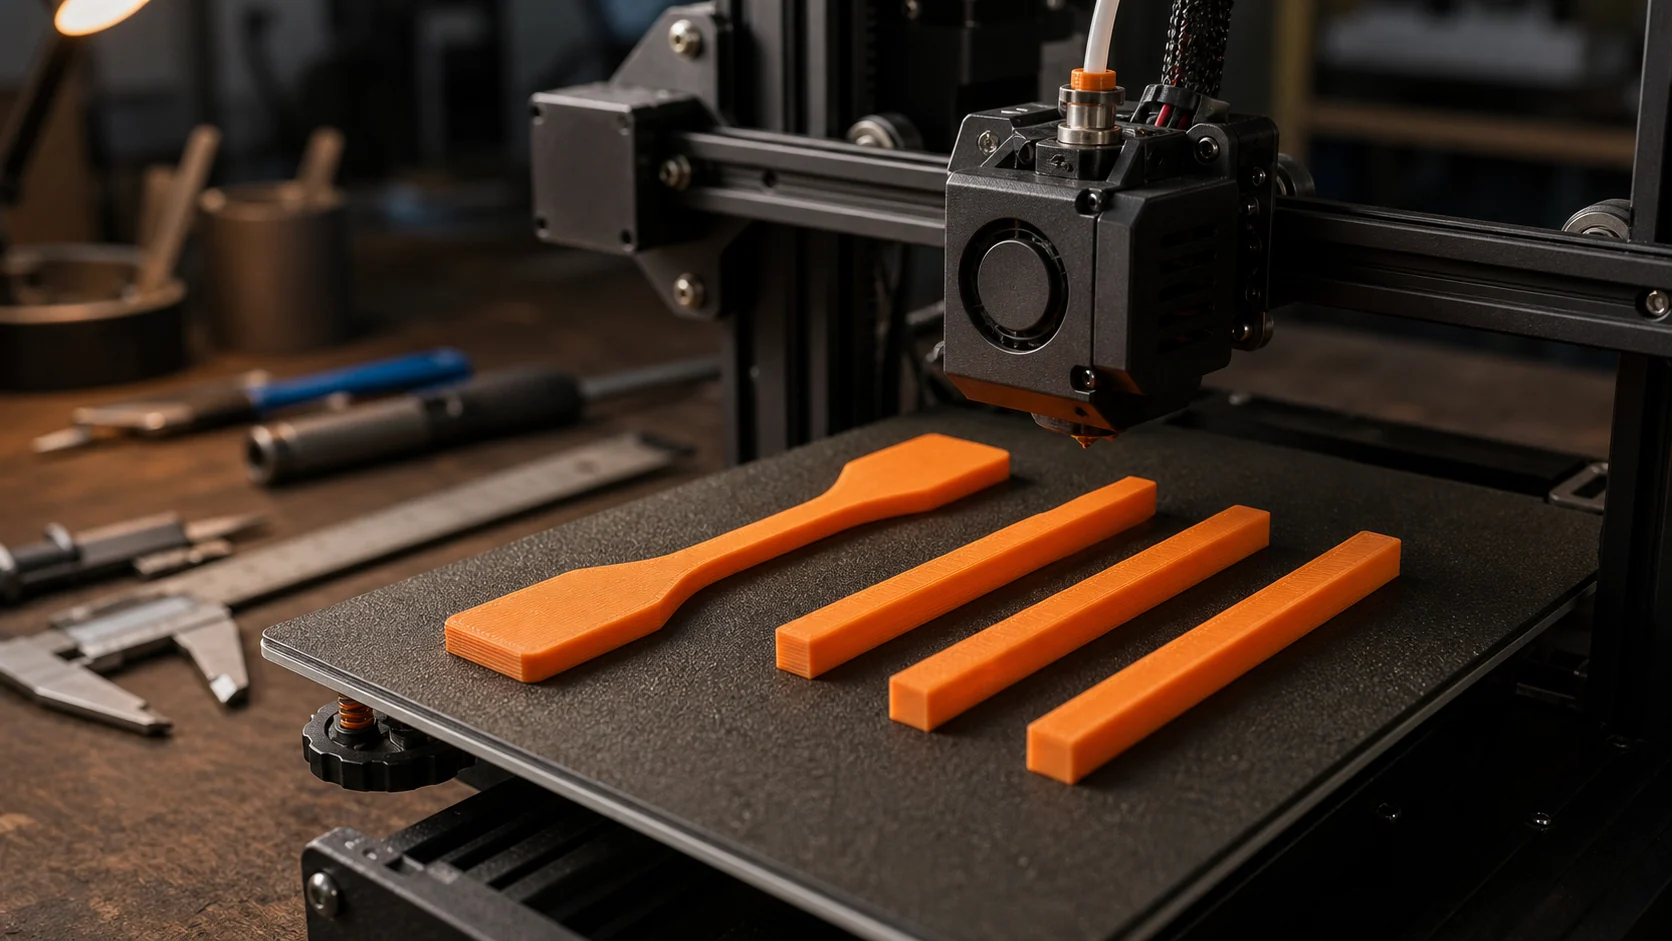 The two specimen families used in this study: a narrow-centred tensile specimen and rectangular bending bars.
If you are here, you probably own a 3D printer—or you are curious enough to want to understand what happens inside one.
Either way, welcome back down the rabbit hole.
This time, the question is simple:
What do the parameters we change in a slicer actually do to the finished part?
We all have our habits.
Someone says 100% infill is strongest. Someone else always prints three walls. Another person lowers the layer height because finer layers feel as though they should produce a better part.
Sometimes those choices work.
But engineering should not be a guessing game.
If changing a slicer setting changes the final product, there should be a scientific way to test that effect.
That is what we set out to do.
The Quick Answer
In this particular PLA study:
- For a part mainly pulled in tension, the strongest validation profile was 0.15 mm layer height, 60 mm/s, 50% infill, and 5 walls, reaching an average maximum load of 572 N.
- For a part mainly loaded in bending, the best observed profile was 0.20 mm layer height, 60 mm/s, 25% infill, and 5 walls, reaching 132.16 N.
- 100% infill did not automatically produce the strongest part.
- Wall count was the clearest individual factor in bending.
Those are study-based starting points, not universal recipes. Printer, filament, orientation, geometry, cooling, and the real load case can all change the result. The experimental design, measurements, and statistical analysis are available in the published IEEE paper.
How Infill, Layer Height, Print Speed and Walls Affect PLA
The study used PLA specimens produced by fused-filament fabrication and focused on four settings that nearly every slicer exposes:
| Parameter | Levels tested |
|---|---|
| Layer height | 0.10, 0.15, and 0.20 mm |
| Print speed | 35, 60, and 100 mm/s |
| Infill | 25%, 50%, and 100% |
| Shells / wall lines | 1, 3, and 5 |
The infill pattern was kept as a mesh formed by lines at approximately ±45 degrees. The nozzle temperature was 210°C, the build plate was 60°C, and the room was held at about 25°C.
Keeping those conditions fixed matters.
If the material, nozzle temperature, infill pattern, print orientation, and room conditions all change at once, we no longer know which change produced the result.
Layer Height
Layer height is the thickness of each deposited layer.
A smaller layer height normally gives you finer vertical detail and more layers. A larger layer height reduces the number of layers and can shorten the print time.
But surface detail is not the same thing as mechanical strength. The way adjacent roads and layers bond also matters.
Print Speed
Print speed controls how quickly material is deposited.
Changing it can influence the time available for the hot material to join the previous road or layer. It can also affect dimensional accuracy, cooling, and the consistency of extrusion.
This does not mean that slow is always strong or fast is always weak. It means speed is part of the thermal and mechanical process, not merely a timer setting.
Infill
Infill is the internal structure inside the outer walls.
More infill usually means more material, more weight, and a longer print. It can also give the outer walls more internal support.
The tempting assumption is:
“If 25% is strong, 100% must be four times as strong.”
That is not how the results behaved.
Shells or Wall Lines
Shells form the continuous outer walls of a print.
In many slicers today, you may see this described as wall line count, perimeters, or wall thickness.
These walls are especially important because material farther from the centre of a part carries a large share of the stress during bending.
That makes wall count much more than a cosmetic setting.
Why Tensile and Bending Test Specimens Have Different Shapes
Before looking at the test machines, it helps to look at the specimens.
They are different because tension and bending apply load in different ways.
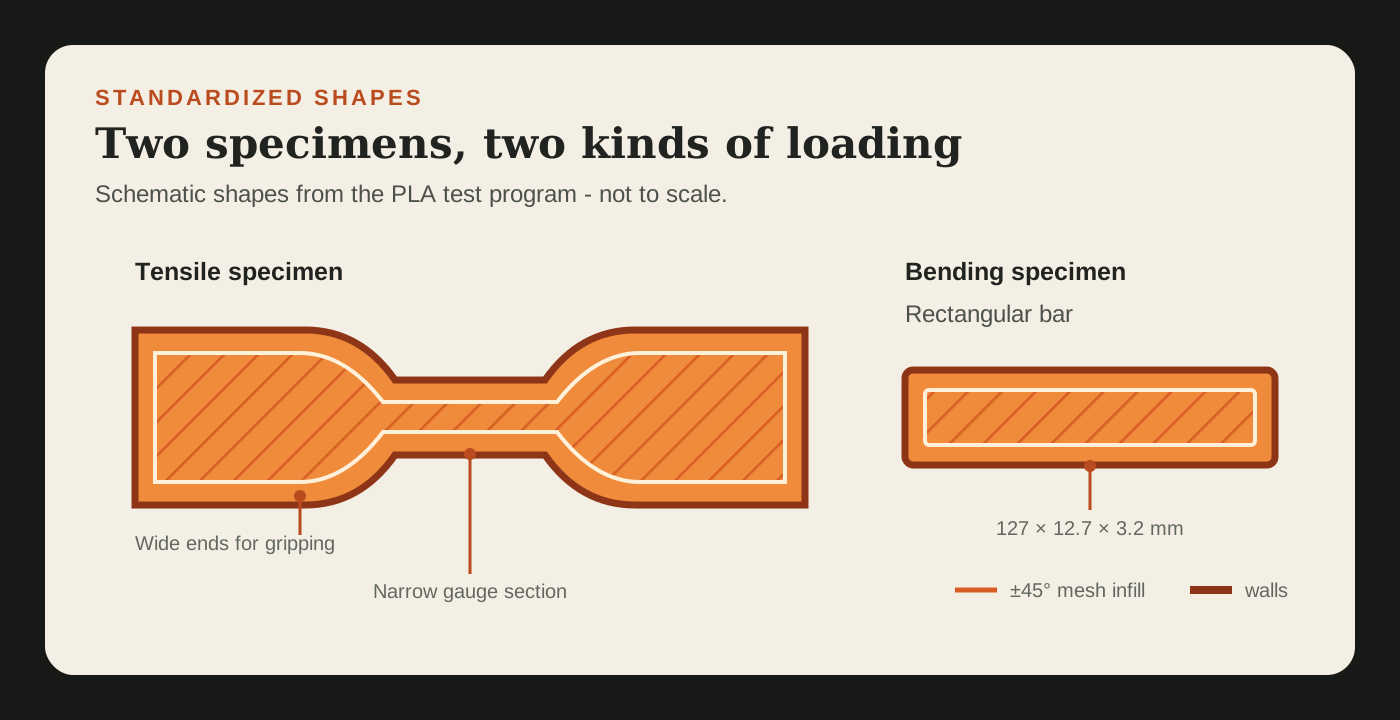 The specimen shapes used for the two load cases. The illustration is schematic and not to scale.
The tensile specimen has the familiar dog-bone shape: wide at both ends and narrow in the middle.
The wide ends give the machine enough area to grip. The narrower middle is called the gauge section. It creates a controlled region where the deformation and eventual failure should occur, away from the grips.
The bending specimen is a straight rectangular bar.
Its simple, constant cross-section lets it rest consistently on two supports while the machine applies a load at the centre. The bending specimens in this study followed the recommended rectangular geometry of approximately 127 × 12.7 × 3.2 mm.
The shapes are not decorative. They are part of the experiment.
If every specimen had a different geometry, we would be testing the shape as much as the slicer settings.
ASTM D638 and ASTM D790: How PLA Strength Was Tested
In the battery guide, I wrote that in engineering there is almost always a standard.
Standards give us common dimensions, definitions, test methods, and reporting rules. They let different engineers prepare and test specimens in a comparable way.
For this study, we used two ASTM standards:
- ASTM D638 — Standard Test Method for Tensile Properties of Plastics. This standard explains how a plastic tensile specimen should be shaped, prepared, gripped, and pulled. It defines several specimen types for different materials and available sample sizes, together with the measurements needed to calculate tensile properties. We used the smaller Type V dog-bone specimen because the available material and printer space were limited. Following the same specimen geometry and test procedure means that a change in the result is less likely to come from one sample simply being wider, narrower, or gripped differently from another.
- ASTM D790 — Standard Test Methods for Flexural Properties of Unreinforced and Reinforced Plastics and Electrical Insulating Materials. This standard describes how a rectangular plastic bar is tested using a three-point-loading arrangement. It controls details such as the specimen geometry, the distance between the two supports, how the load is applied at the centre, and how force and deflection are evaluated. The recommended rectangular specimen used in this study was approximately 127 × 12.7 × 3.2 mm. D790 also matters when interpreting the end of a test: a specimen that continues bending without failing inside the method's permitted strain or deflection conditions cannot simply be reported as though it completed an ordinary flexural-strength test.
These standards do not tell us which slicer settings will win.
They give us a controlled playing field on which those settings can be compared.
What Is a Tensile Test?
A tensile test answers a straightforward question:
What happens when we pull the specimen apart?
The wide ends of the dog-bone specimen are clamped inside two grips. The test machine then moves the grips away from each other at a controlled rate.
As the narrow gauge section stretches, the machine records:
- The pulling force
- The extension or displacement
- The maximum load
- Where and how the specimen fails
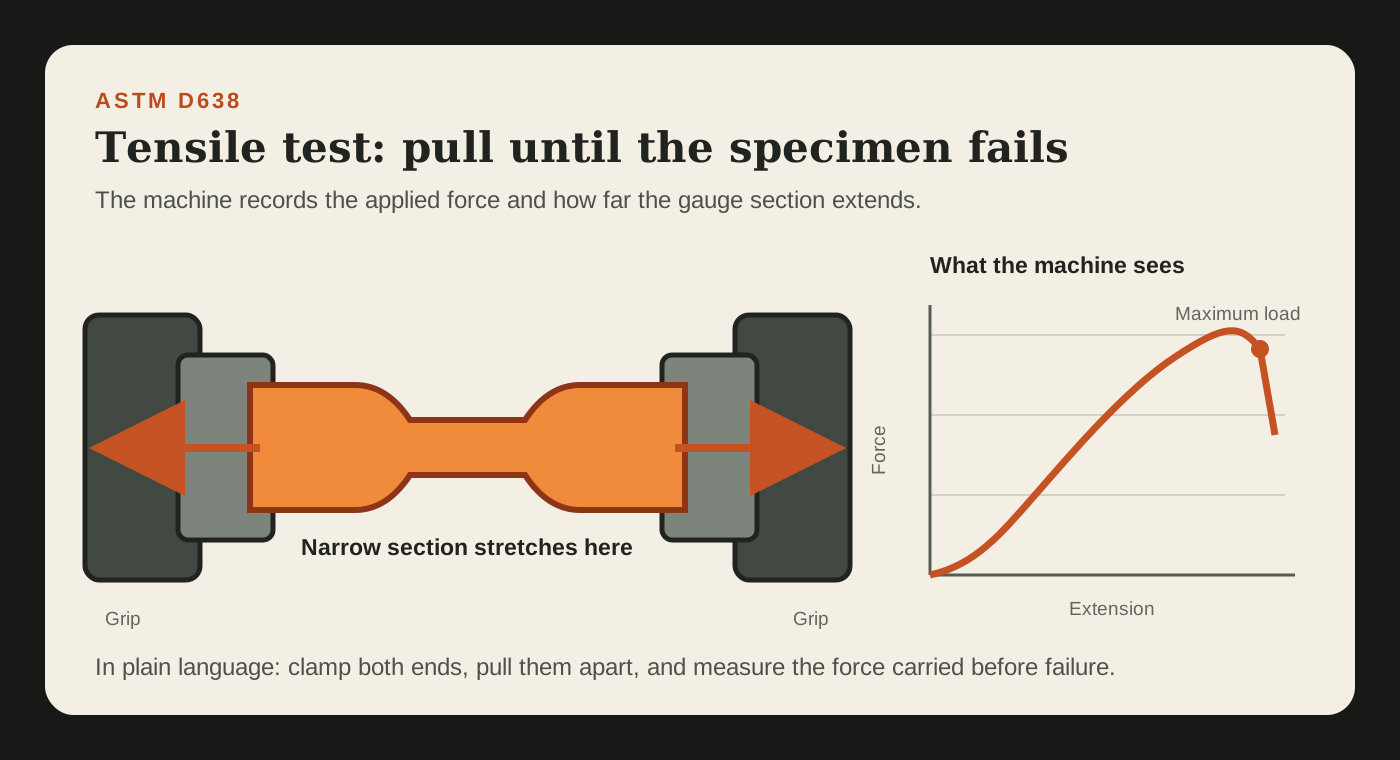 A tensile test pulls in opposite directions while recording force against extension.
At first, the specimen resists the load and stretches. As the force rises, the printed roads and layers carry that load together. Eventually, damage begins, the specimen can no longer carry more force, and it fails.
In this article, maximum tensile load means the greatest pulling force recorded before the specimen lost its ability to carry the increasing load.
It is important not to confuse load with a universal material strength. Load is a force measured in newtons. A material property such as tensile stress also accounts for the specimen's cross-sectional area.
Because the specimens were prepared to the same controlled geometry, maximum load gives us a useful way to compare the different print settings inside this experiment.
What Is a Three-Point-Bending Test?
A three-point-bending test asks a different question:
What happens when we support the ends and press the middle?
The rectangular specimen rests on two support rollers. A third loading nose moves downward at the centre, giving the test its name: two support points plus one loading point.
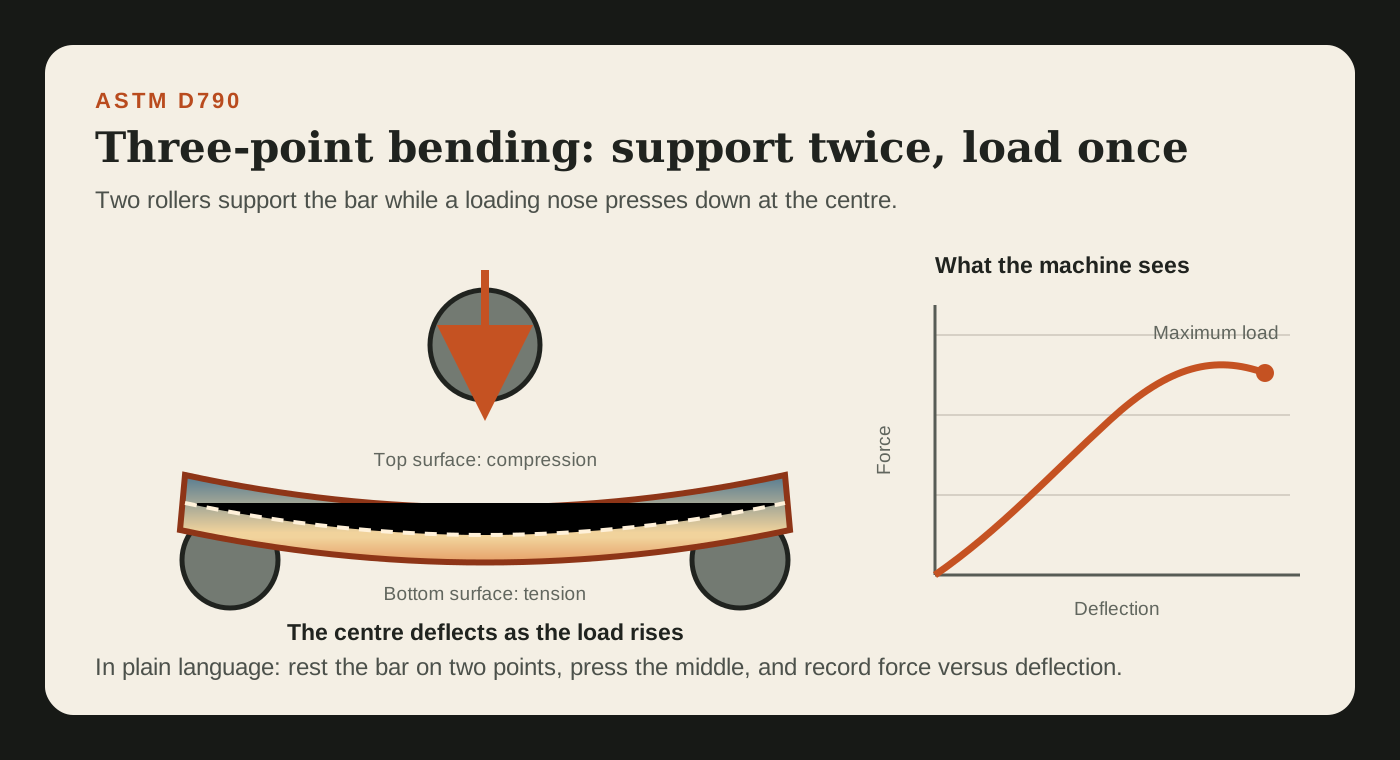 The upper surface is compressed while the lower surface is stretched in tension.
The test machine records:
- The downward force
- The centre deflection
- The maximum load
- Whether the specimen cracks, breaks, or continues bending
The top of the bar is squeezed in compression. The underside is stretched in tension. Between them is a region where the longitudinal stress passes through zero, often called the neutral axis.
This stress distribution is why outer walls matter so much in bending. Material near the outside surfaces is positioned where the tensile and compressive stresses are highest.
The standard is important because we are not simply printing random shapes, squeezing them by hand, and deciding which one feels stronger.
The specimen geometry, support arrangement, and test method are controlled.
That does not make one small experiment universal. It makes the experiment repeatable and the comparison meaningful.
Testing 81 Possibilities Without Printing 81 Combinations
Four parameters with three possible levels each produce:
3 × 3 × 3 × 3 = 81 possible combinations
Printing and testing every combination would require a large amount of time and material.
Instead, we used a Taguchi L9 orthogonal array.
In plain language, the Taguchi method is a structured way to select a smaller set of balanced experiments. It reduced the initial matrix from 81 combinations to nine while still allowing us to compare the influence of the four parameters.
Three specimens were produced for each combination for both tensile and bending tests, giving 54 specimens in the main test matrix.
We then used a larger-is-better signal-to-noise ratio to rank the parameters and carried out analysis of variance to examine how much of the variation was associated with each one.
That phrase sounds more complicated than the basic question:
Which settings consistently moved the maximum load upward, and which settings were mostly lost inside the experimental variation?
The complete test matrix and its maximum loads were reported together in Table III of the published paper:
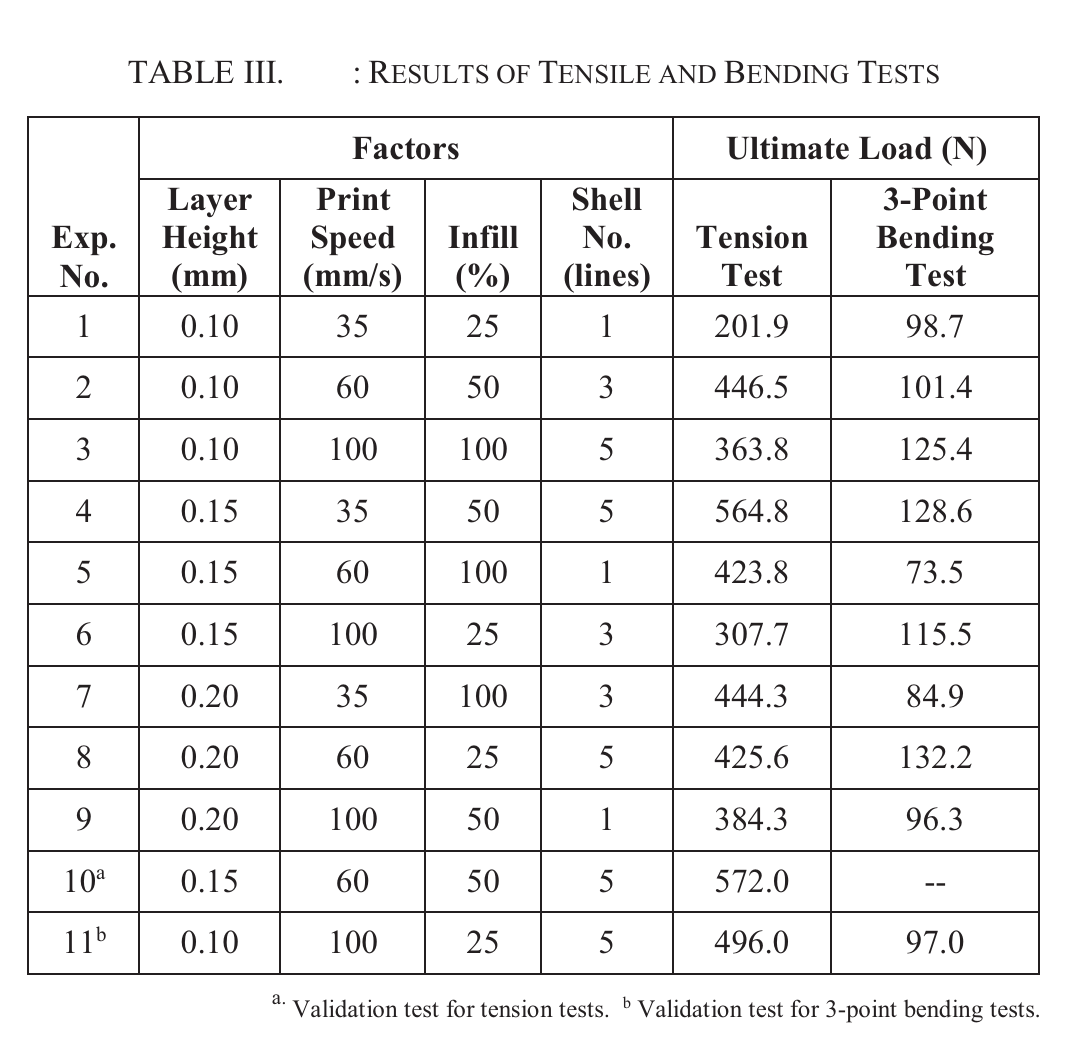 Table III from the published paper. Rows 10a and 11b are the tensile and three-point-bending validation tests.
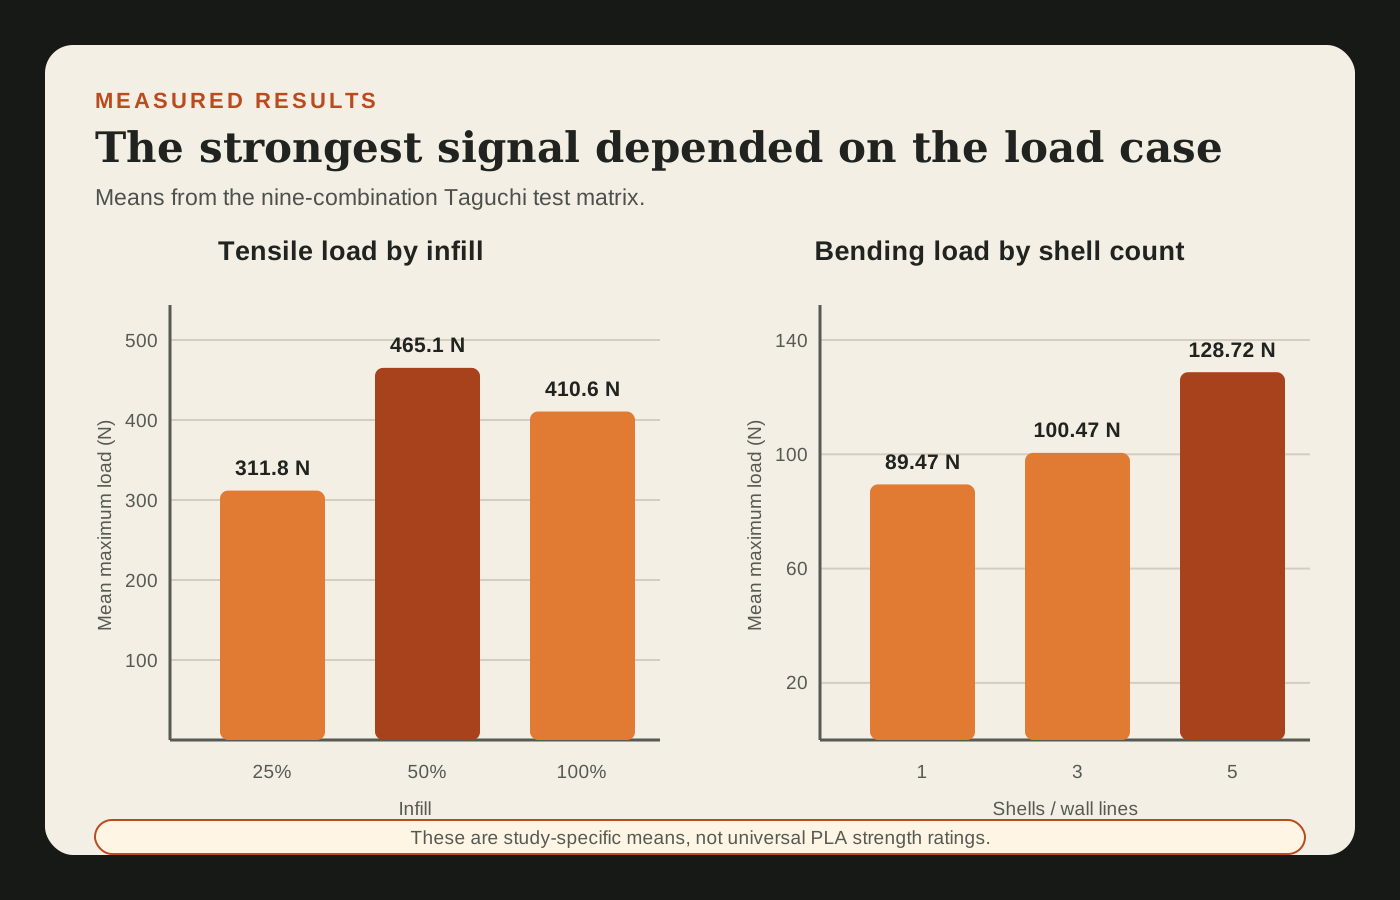 The leading signal changed with the load case: infill ranked first in tension, while shell count was the clearest factor in bending.
PLA Tensile Test Results
For tensile loading, the Taguchi signal-to-noise ranking was:
- Infill
- Number of shells
- Layer height
- Print speed
Within the tested levels, the mean maximum load was highest at:
- 50% infill
- 5 shells
- 0.15 mm layer height
- 60 mm/s print speed
The verification specimens printed with that combination carried an average maximum load of 572 N.
That was the highest tensile result recorded in this study, narrowly above 564.75 N from a different combination using 0.15 mm layers, 35 mm/s, 50% infill, and 5 shells.
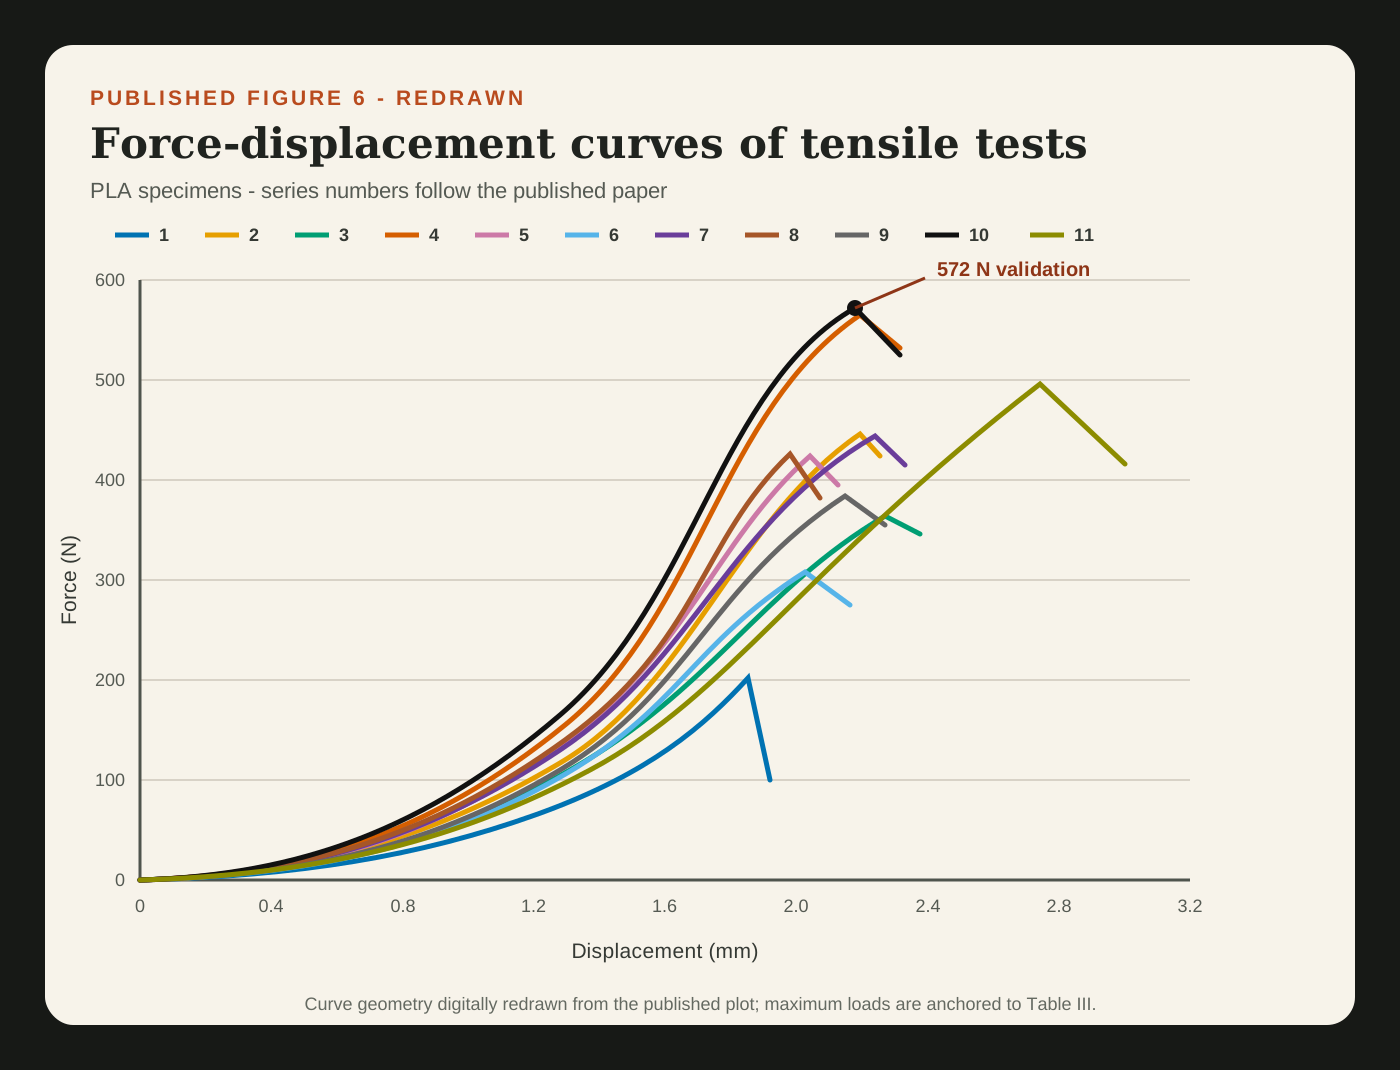 Figure 6, redrawn from the published paper for readability. The curve shapes follow the published plot, while the maximum loads are anchored to Table III rather than reconstructed from raw machine data.
There is an important lesson hiding here:
The best tensile result did not use 100% infill.
In fact, the mean maximum loads across the three infill levels were approximately:
| Infill | Mean maximum tensile load |
|---|---|
| 25% | 311.8 N |
| 50% | 465.1 N |
| 100% | 410.6 N |
This does not prove that 50% infill is always stronger than 100% infill.
The settings were tested as combinations, not in isolation, and the individual tensile-factor ANOVA results did not cross the conventional 0.05 significance threshold. For example, infill produced the strongest tensile ranking but had a p-value of 0.172 in the one-way analysis.
The careful conclusion is that infill and shell count produced the largest tensile signals within this experiment, and that blindly selecting 100% infill was not supported by these results.
PLA Three-Point-Bending Test Results
For three-point bending, the ranking changed:
- Number of shells
- Infill
- Print speed
- Layer height
Shell count was the clearest result in the study.
The mean maximum bending loads were:
| Shells | Mean maximum bending load |
|---|---|
| 1 | 89.47 N |
| 3 | 100.47 N |
| 5 | 128.72 N |
Moving from one shell to five increased the mean maximum bending load by about 44% in this test matrix.
Shell count also produced a p-value of 0.019, making it the only individual factor in these one-way analyses that crossed the conventional 0.05 significance threshold.
This result makes mechanical sense.
During bending, the highest tensile and compressive stresses occur near the outer surfaces of the specimen. Adding continuous outer walls places more material where those stresses are greatest.
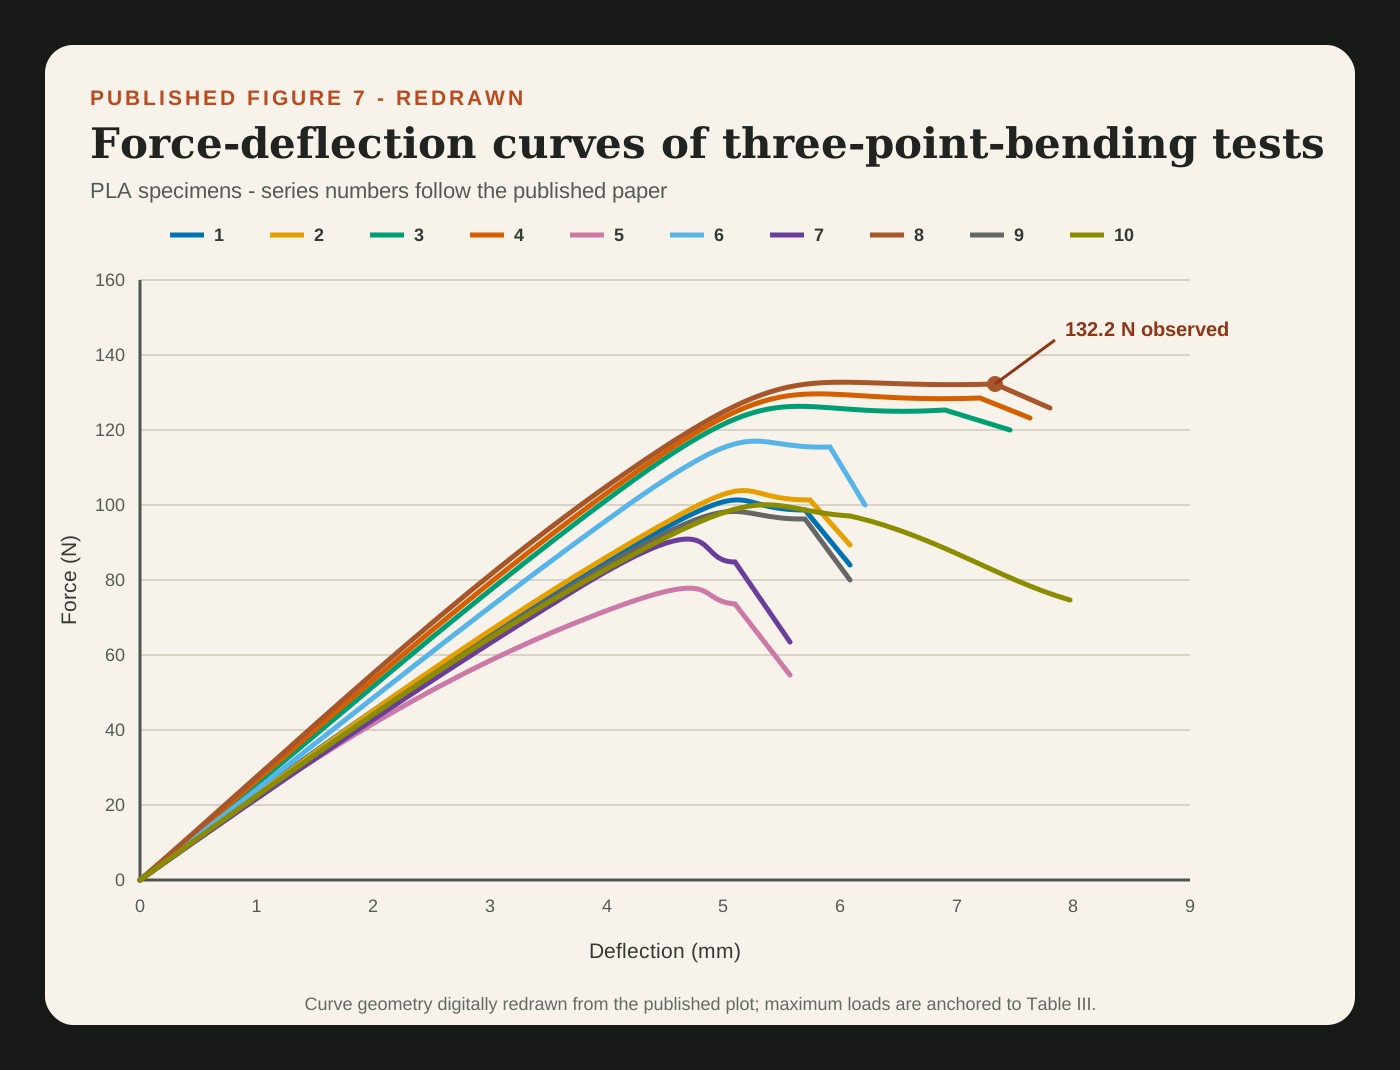 Figure 7, redrawn from the published paper for readability. The series numbering follows the published figure, and the maximum loads are anchored to Table III.
The highest bending load observed among the original nine combinations was 132.16 N, from:
- 0.20 mm layer height
- 60 mm/s print speed
- 25% infill
- 5 shells
The Taguchi-predicted combination was then printed as a validation test:
- 0.10 mm layer height
- 100 mm/s print speed
- 25% infill
- 5 shells
That validation produced 97 N, lower than the best observed combination. It also did not satisfy the maximum-deflection condition used in the ASTM D790 evaluation.
So I would not present the 97 N setup as a universal “optimum.”
An optimization model is still a prediction until the confirmation test agrees with it.
Here, the confirmation test told us that more work was needed.
Why 100% Infill Did Not Automatically Win
At first glance, this is the most surprising part of the experiment.
More material should mean more strength, should it not?
Often it helps, but the complete part is a system.
Its behaviour also depends on:
- How the outer walls carry the load
- How the infill joins the walls
- The direction of the deposited roads
- Bonding between layers
- Voids and extrusion consistency
- Cooling and residual stress
- The direction of the applied load
- The geometry of the specimen
In this experiment, increasing the shells was more valuable for bending than simply filling the entire interior.
That does not make dense infill useless. It means infill percentage alone is a poor definition of strength.
If you are designing a functional part, ask where the load travels.
That question is usually more useful than asking only how solid the part is.
A Note About Cooling
During specimen production, cooling became part of the practical problem.
Changes in cross-section can cool at different rates. Uneven cooling can introduce residual stress, deformation, or weak regions before the mechanical test even begins.
Metal bars were placed beside the narrow gauge region of the tensile specimens to reduce abrupt cooling differences during printing.
This is a reminder that the slicer is not the whole process.
Room temperature, drafts, bed temperature, material condition, machine calibration, and cooling behaviour can all influence the part that eventually reaches the test machine.
A perfectly recorded slicer profile does not help much if the surrounding process is uncontrolled.
Best PLA Slicer Settings to Try from This Study
If I reduce the study to practical workshop lessons, these are the points I would keep:
Starting Point for a Part That Must Be Strong in Tension
If I were printing a PLA part whose main job was to resist being pulled apart, this is the first profile I would try from the tested range:
| Setting | Study-based starting point |
|---|---|
| Layer height | 0.15 mm |
| Print speed | 60 mm/s |
| Infill | 50% |
| Shells / wall lines | 5 |
| Infill pattern | ±45° mesh |
| Nozzle temperature | 210°C |
| Build-plate temperature | 60°C |
This was the tensile validation combination that carried an average maximum load of 572 N in the standardized specimens.
I would treat it as a starting profile, not a guaranteed recipe. The orientation of the real part should keep the expected pulling load running through continuous deposited roads wherever possible. A change in filament, nozzle, extrusion width, machine, part geometry, or orientation means the profile needs to be tested again.
Starting Point for a Part That Must Resist Bending
If the part must resist a load that tries to bend it, I would begin with the best observed bending combination from the original nine tests:
| Setting | Study-based starting point |
|---|---|
| Layer height | 0.20 mm |
| Print speed | 60 mm/s |
| Infill | 25% |
| Shells / wall lines | 5 |
| Infill pattern | ±45° mesh |
| Nozzle temperature | 210°C |
| Build-plate temperature | 60°C |
That combination carried a maximum bending load of 132.16 N in the test specimen.
The most useful setting here is the five outer walls. Shell count produced the clearest bending result, while increasing infill to 100% did not automatically improve the result.
But “carries the highest load” and “flexes the least” are not exactly the same measurement.
This study ranked the settings mainly by maximum load. If the real goal is minimum deflection, I would keep the five-wall starting point and also change the design itself: increase the section depth in the direction of bending, add ribs where appropriate, shorten unsupported spans, and orient continuous walls along the load path. Geometry can make a much larger difference to stiffness than a slicer adjustment alone.
1. Add walls deliberately
For parts that resist bending, increasing the wall count can be more effective than jumping directly to 100% infill.
2. Do not treat infill percentage as a strength rating
Infill interacts with the walls, pattern, orientation, and load direction. A percentage by itself does not tell the whole story.
3. Fine layers are not automatically stronger layers
Layer height affects detail, time, and bonding, but the smallest layer height did not dominate the mechanical results here.
4. Speed is part of the process
Print speed changes more than the completion time. It can affect deposition and bonding, but it was not the leading factor in these tests.
5. Verify the combination
A statistical model can suggest a promising setup. Print it and test it before calling it optimum.
6. Test the load case you actually care about
A setting that performs well in tension may not be the best setting in bending. A real component may also face impact, fatigue, heat, creep, torsion, or repeated loading.
“Strong” is incomplete until you say strong against what.
How to Run a Small Experiment of Your Own
You may not have access to a universal testing machine, but you can still improve on guesswork.
- Choose one material, one printer, one nozzle, one orientation, and one specimen geometry.
- Write down the settings you will keep fixed.
- Select a small number of parameters and levels to compare.
- Print several specimens for every setup—not just one.
- Condition and test them in the same way.
- Record failure load, failure location, mass, print time, and visible defects.
- Change conclusions only when the repeated results support them.
The measuring setup must suit the risk of the part.
A simple workshop jig may teach you a great deal about a bracket or enclosure. It is not a substitute for calibrated equipment and the correct standard when failure could injure someone or cause serious damage.
Take These Results with a Grain of Salt
This post is based on research I supervised and co-authored. The results are real, but they belong to a particular experimental window:
- One material: PLA
- One printer and extrusion setup
- One infill pattern
- One print orientation
- Three levels for each selected parameter
- Tensile and three-point-bending loads
- Maximum load as the main comparison
We did not vary every factor that matters.
Nozzle diameter, extrusion width, material brand, moisture, raster orientation, part orientation, cooling fan strategy, nozzle temperature, bed adhesion, infill pattern, and machine calibration can all change the result.
Even the word strength needs care here. The study primarily compared the maximum force carried by standardized printed specimens. That is not a universal material property that can be copied directly into every design.
Use the findings as evidence and as a starting point—not as a magic PLA profile.
PLA 3D Printing Strength FAQ
What infill percentage is strongest for PLA?
There is no single strongest infill percentage for every PLA part. In this study, 50% infill produced the highest mean maximum tensile load across the tested levels, while the best observed bending combination used 25% infill and 5 walls. The answer changes with part geometry, orientation, wall count, infill pattern, printer, filament, and load direction.
Is 100% infill always strongest?
No. The 100% infill specimens did not produce the highest mean tensile load in this experiment, and dense infill did not outperform five outer walls in the best observed bending result. More material can help, but how that material is placed along the load path matters just as much.
Do more walls make a 3D print stronger?
They can, especially when a part must resist bending. In this test matrix, increasing the shell count from one to five raised the mean maximum bending load by about 44%. Shell count was also the only individual factor in the one-way bending analysis to cross the conventional statistical-significance threshold.
What layer height gives the strongest PLA print?
There is no universal strongest layer height. The successful tensile validation used 0.15 mm, while the best observed bending combination used 0.20 mm. A smaller layer height can improve detail, but it is not automatically stronger. Treat layer height as one interacting part of the complete print process.
Are these settings suitable for every functional part?
No. They are useful starting points for repeating this study's tensile or bending behaviour, not design allowables for an arbitrary component. For a real part, also consider orientation, load direction, temperature, creep, fatigue, impact, safety factor, and what happens if the part fails.
What matters more for PLA strength: walls or infill?
It depends on the load case. In this study, infill and wall count produced the strongest signals in tension, while wall count was the clearest individual factor in bending. For a bending-dominated part, adding deliberate outer walls may be a better first experiment than jumping straight to 100% infill. The final choice still needs validation with the intended geometry and load.
Does print orientation affect PLA strength?
Yes. Orientation changes how deposited roads, perimeter paths, and layer interfaces carry the applied load. This study held orientation fixed, so its results compare slicer settings within that orientation rather than ranking different orientations. Print and test the real part—or representative specimens—in its intended build and loading direction before treating a profile as proven.
Read the Published Paper
You can read the published paper on IEEE Xplore.
If you cannot access it through IEEE Xplore or your institution, drop us an email at info@attalos.life, and I will be happy to share a copy.
Final Thoughts
What began as a few ordinary slicer settings became a study of experimental design, standardized specimens, tensile loading, bending, cooling, statistics, and confirmation tests.
That is the rabbit hole.
Layer height, speed, infill, and shells do affect the final part. But they do not act independently, and the most intuitive setting does not always produce the best result.
For tensile loading, infill and shells produced the strongest signals in our test range.
For bending, shells were the clearest factor.
And 100% infill did not automatically win.
The larger lesson is not that everyone should print PLA at one exact combination of settings.
It is this:
Do not guess when you can define, test, compare, and verify.
Because engineering is not a guessing game.